Global Energy Consumption
Energy Consumption vs the estimated lifetime of fossil fuels
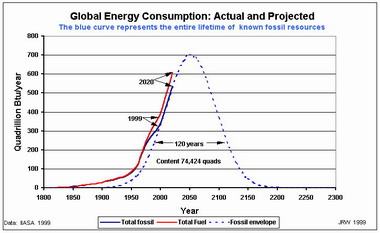
While the fossil-fuel curve is idealized and fitted to the available consumption data, it is nevertheless quantitative. Its content represents the total known accessible resources of gas, oil and coal according to the 1999 statistics provided by the international agencies named.
The solid lines represent the IIASA/IEA data for the growth of fossil fuel consumption over the years to date and projected by them to the year 2020. What goes up must come down and the dotted bell curve is an idealized but quantitative representation of how the use of fossil fuels might progress from now on. The bell curve was chosen to provide the gentlest let-down possible. Its content is the IIASA/IEA 1999 estimate [3] of the total available gas, oil and coal supplies, expressed in Quadrillion BTUs of generated energy (Quads for short). The height and width of the bell curve were determined by matching the rising slope to that of the solid curves and sliding it along the time axis to fit. Because the area is given, there is only one solution that fits the data – the unique solution shown. I now believe the global demand will inevitably overshoot the 700 Quad level, thus increasing the probability of a rapid, catastrophic descent which could easily result in a state of anarchy among the leading consumers. This will occur in three stages (oil, gas and coal) if sufficient anarchy is not triggered by the first stage – the shortage of oil.
One Quad is a lot of energy. It is roughly equivalent to the energy produced by 33 one-Gigawatt power stations in one year. One Quad is approximately the amount of energy obtained from each of the following:
36 million tonnes of coal (400,000 rail cars).
24 million tonnes of oil (167 million barrels).
28 billion cubic metres of natural gas.
33 standard (1 gigawatt) electric power stations in one year (coincidentally, the number in Ontario).
600 km2 aggregate surface area of 10% efficient photoelectric solar collectors at sea level in clear conditions in one year.
33,000 1 MW strategically placed windmills operating at peak level for one year.
No allowance is made for transmission or conversion efficiency beyond the point of generation, or for cloudy (solar) or calm (wind) conditions.
A reduction of fossil fuels by 1 Quad (e.g. replacing about 33 coal-fired power stations by 33 nuclear stations in one year) is too small a change to make a noticeable difference in the above diagram which shows that consumption of fossil fuels is currently rising at the rate of 22 Quads/annum. 10 Quads reduction would be required just to accommodate the growth in demand. 20 Quads/annum reduction would be required to begin to replace fossil fuels at an adequate rate. Even replacement at this enormous rate would not avoid further climatic disruption and irreparable damage to the environment.